
What’s Really Going on in the Indian Economy?
It is probably only to be expected that the official account, in the Finance Ministry’s justreleased Economic Survey 2025-26, would be generally upbeat about the Indian economy and the current policy direction of the Modi government. We have also come to expect that data will be cherry-picked to provide the best and most optimistic outlook. Yet, even within this document, it is possible to find intimations of the serious problems facing the economy, and the urgent need for a policy reset.
The most obvious question that emerges from the reading of the Survey is: if the economy is really doing so well and being so dynamic, why is private investment not increasing more? And why are both domestic and foreign investors choosing to put their funds abroad rather than investing in the country? The Survey chooses to highlight recent increases in Gross Fixed Capital Formation (investment) that “indicate a strengthening of the investment cycle, supporting growth” (page 12). Yet even a slightly longer look would reveal a genuine weakness, particularly in private investment.
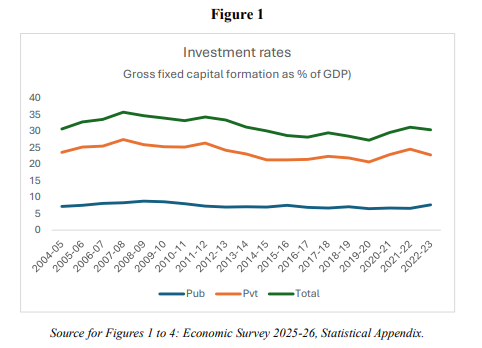
Figure 1 shows that there has been a decline in investment rates, which peaked at nearly 36 per cent of GDP in 2007-08, and that the rate stabilized, but did not recover to earlier levels, in the period after 2015. Indeed, the investment rate over the years of the UPA government (2024-25 to 2013-14) averaged at 34.3 per cent, whereas the average rate for the subsequent NDA
government (2014-15 to 2023-24—the latest year for which data are provided) was only 24.2 per cent. Significantly private investment did not recover, despite the many blandishments and incentives like the significant and unwarranted cut in corporate tax rates in 2019.
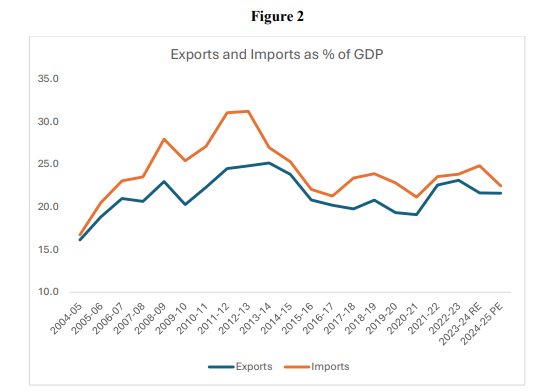
It could be argued that, notwithstanding high GDP growth rates, there was significant leakage abroad through imports. India’s trade deficit has been rising significantly in absolute US dollar terms. Yet, as Figure 2 indicates, while imports as a share of GDP rose sharply in the UPA years, they have come down since and remain at much lower levels. It is also true that exports have declined and then stagnated relative to GDP—so they have not generated additional net demand from the trade sector.
So what explains the sluggishness of domestic investment, especially private investment? A new set of “High Frequency Indicators” helpfully provided for the first time in the Survey can provide some clues. These are particularly important since it is now more widely acknowledged both inside and outside the country, that GDP itself is a problematic indicator of economic
progress, but also India’s GDP data are less reliable and more open to question.
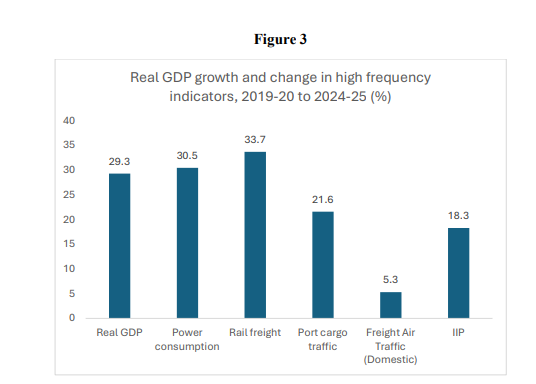
Figures 3 and 4 show the movement of some of these indicators relative to real and nominal GDP, from 2019-20 onwards. (The numbers are calculated as annual averages from the monthly data provided in the Statistical Appendix of the Economic Survey.) The figures show the total change (in percentage terms) over the four years for which the data are available.
From Figure 3, we can see that both electricity consumption and rail freight volumes generally tracked GDP growth, showing if anything slightly higher increases. But the port cargo traffic increase was significantly lower, and domestic air freight traffic increased only marginally over the four-year period. The Index of Industrial Production (IIP) also grew much less than real
GDP, suggesting a continued process of stalled industrialization or even deindustrialization in the economy, despite declared attempts to attract private corporate investment into manufacturing. (Note that the IIP shows a different trend than manufacturing or industrial GDP, which is overly influenced by the balance sheets of large corporate entities that account for
only a fraction of total industrial activity in the economy.)
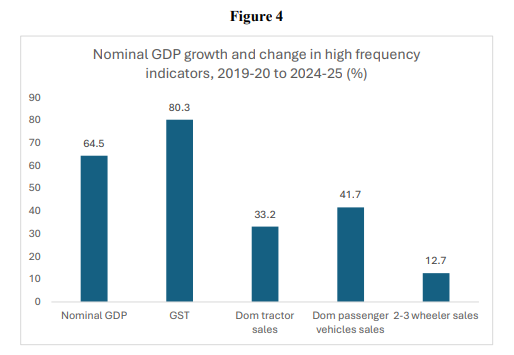
It is reasonable to expect that variables such as sales and GST collections will track nominal GDP, and that is examined in Figure 4. One striking point is how much greater the increase in GST has been, compared to nominal GDP. Since GST is an indirect tax that is inevitably much more regressive than direct taxes like income tax, this suggests that the fiscal policy has put a greater burden on the less well-off sections of the population and thus added to inequality. Vehicle sales have clearly increased much less than nominal GDP. Tractor sales grew at around half the growth of nominal GDP, a further reflection of the relative weakness of agricultural incomes. Domestic passenger vehicles sales also increased much less, and it should be noted that the greater part of this was in the higher-end and luxury car segment. This process of differentiation is further confirmed by the very low expansion of two- and three-wheeler sales over the past few years. Since these are the first personal vehicles typically purchased by those from lower income groups when they have the capacity to do so, this sluggish growth provides an important indication of the K-shaped nature of Indian economic growth.
More comprehensive confirmation of this growing inequality comes from data which are not provided by the Economic Survey, even though they are (still) available from official surveys—the trend in wage incomes. Figure 5 shows how the real GDP and real per capita national income increased over the period 2017-18 to 2023-24, along with data on wage and selfemployed incomes in constant prices over the same period. The years are chosen because those are the years for which data from the Periodic Labour Force Surveys are available.
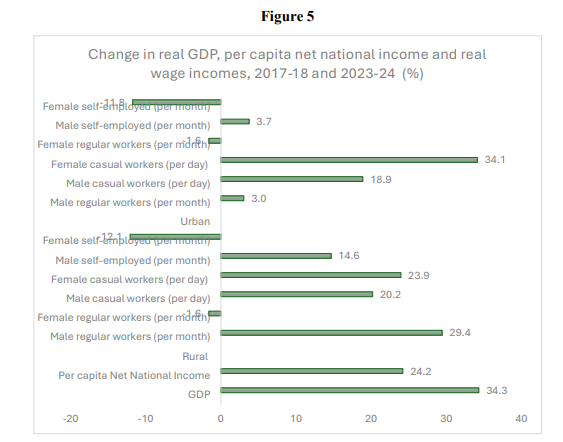
Sources: GDP and per capita NNI from Economic Survey, 2025-26; wage and self-employed income data from Periodic Labour Force Surveys, various issues, deflated by consumer Price Index.
Figure 5 reveals beyond doubt that economic growth in India has been increasingly unequal, that wage incomes and incomes of the self-employed have not increased along with GDP growth. Female casual workers in rural areas are the only worker category for whom real wages have increased in tandem with GDP and slightly more than per capita NNI—but such workers comprise less than 8 per cent of those recognised as employed in rural areas, compared to around 18 per cent who get no remuneration at all, since they are described as “unpaid helpers in family enterprises”. Rural male regular workers are the other category whose wages showed broadly commensurate increases over this period, but even this is a very small proportion of rural male workers. Women workers in “regular” jobs experienced absolute declines in real wages on average.
In general, most wage increases were significantly below the increase in both aggregate and per capita national income over this period, indicating that overall wage income growth was well below the change in GDP. The most shocking pattern is evident for self-employed incomes, which declined significantly for women over the period. Even for self-employed men in rural areas, real incomes barely increased.
This explains what might otherwise appear to be a paradox: declining or stagnant mass consumption demand despite rising aggregate GDP. This inequality is not just a sad reflection on the Indian growth trajectory; it also helps to explain why private investment is lacklustre and mostly responds to government contracts rather than domestic mass demand. This also explains the employment crisis that is becoming more evident with every passing day. This is the real problem that the Economic Survey should have identified, and that the Budget and other policies of the government should seek to address.
(This article was originally published in the Business Line on 4 February 2026.)