The Misplaced Growth Discourse
With the GDP estimates for the fourth quarter of 2017-18 placing growth relative to the corresponding quarter of the previous year at 7.7 per cent, talk of India being the world’s fastest growing economy has revived. Moreover, since the year-on-year quarterly growth rates have risen from 5.6 per cent in the first quarter of 2017-18 to 6.3, 7.0 and 7.7 per cent in the subsequent three-quarters, there is talk that India is once more on a trajectory of accelerating growth (Chart 1).

However, the story emerging from the provisional annual figures (which are also now available) is at variance with this. If annual rates are considered, the GDP growth rate has fallen from 7.1 per cent in 2016-17 to 6.7 per cent in 2017-18. The fall in the rate of growth of Gross Value Added (GVA) at basic prices is marginally higher, from 7.1 to 6.5 per cent. Moreover, the quarterly rates do seem to be influenced by a ‘base effect’, involving higher rates because of lower than trend values in the previous year. The trends in quarterly growth rates in 2016-17 was the reverse of that in 2017-18, with the former falling from 8.1 per cent to 7.6, 6.8 and 6.1 per cent.
Even setting aside skepticism about the new series on GDP and its quarterly version, there are a number of features of the growth trajectory which suggest that it is not robust. Prime among these is the deceleration of growth in the commodity producing sectors. The growth of Gross Value Added (at constant prices) in agriculture and allied activities has fallen from 6.3 per cent in 2016-17 to 3.4 per cent in 2017-18, that in mining and quarrying from 13 to 2.9 per cent and that in industry from 7.9 to 5.8 per cent. The growth rates in 2017-18 have risen only in Construction (13. To 5.7 per cent), Trade, hotels, transport and communication (7.2 to 8.0 per cent), and Financial, real estate and professional services (6.0 to 6.6 per cent). Meanwhile, conservatism in public spending has meant that GVA growth in Public administration and defence has fallen from 10.7 to 10 per cent. And without support from the commodity producing sectors, GVA growth in Electricity, gas, water supply and other utility services has decelerated from 9.2 to 7.2 per cent.
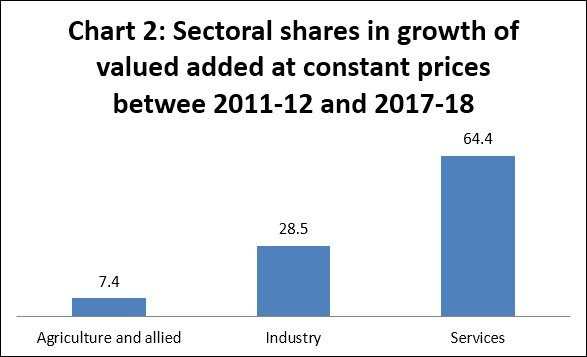
This focus of growth on a few service sectors and absence of dynamism in the commodity producing sectors has meant that Services account for a significant part of the increment in GVA in recent years. Considering the period since 2011-12, from when the current national accounts series became available, we find that while Agriculture and allied sectors accounted for just 7.4 per cent of the increase in aggregate GVA over 2011-12 to 2017-18 and Industry for 28.5 per cent, Services contributed 64.4 per cent (Chart 2).

Services are of two kinds: those characterized by high value added per worker (because of high per worker revenues as in IT services or per worker state expenditures as in some social services) and relatively low absolute employment measures; and those with extremely low valued added per worker, but high absolute employment numbers. The latter services are the sink for the large workforce unable to find employment in the poorly performing commodity producing sectors. The high share of Services in the increment in GVA points to partly self-fuelling growth of the “new services” and their reliance on low-cost, outsourced domestic services of various kinds, such as logistics, catering and security. The so-called high productivity services derive their high value added by contracting out to those operating with low cost workers in precarious employment.
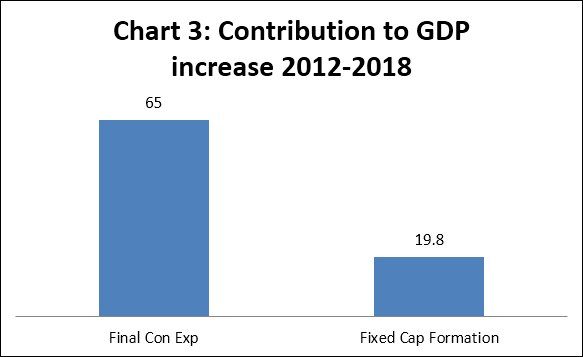
A second feature of the growth process is that it is overwhelmingly driven by consumption expenditure. Increases in Final Consumption Expenditure accounted for 65 per cent of the increase in GDP between 2011-12 and 2017-18, whereas increases in Gross Capital Formation contributed 19.8 per cent (Chart 3). In 2016-17 and 2017-18, despite high growth, private final consumption expenditure accounted for around 56 per cent of GDP and government final consumption expenditure for another 10-11 per cent, whereas gross fixed capital formation amounted to 31 per cent. These figures contrast hugely with the Chinese case, where investment has contributed close to 50 per cent of GDP for years, and where the government is now attempting to “rebalance” consumption and investment by curtailing the latter. In India’s case, the fact that high growth has not been accompanied by higher investment levels is explained by two factors: the overwhelming role of less capital intensive services in overall growth; and the “leakage” of domestically generated demand abroad because of the import intensity of domestic supply. To the extent imports service domestic demand, the inducement to investment from domestic demand is that much lower.

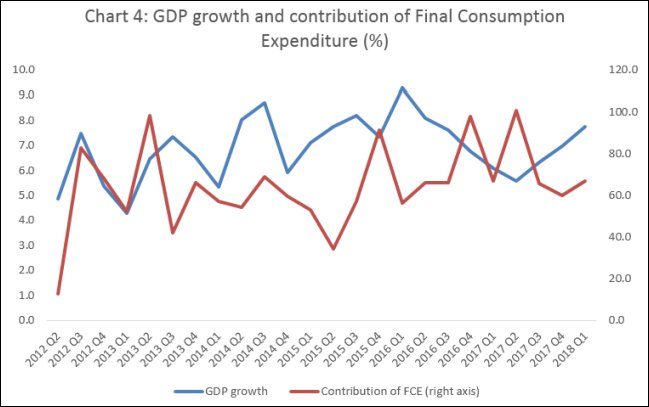
The role of consumption expenditure in aggregate demand and growth also comes through partly in Chart 4, which traces the relationship between quarterly GDP growth and the contribution of final consumption expenditure to the increment in GDP. The movements of the two variables point to some relationship between the two with some lags and leads and some exceptional quarters.

What do all of these features add up to in terms of an assessment of India’s output dynamism? Clearly, production and productivity in any meaningful sense have been the casualties in the recent trajectory of the Indian economy. Consumption demand (including that from government consumption) dominates, implying that investment induced by domestic or external demand is not the driving force behind the growth in consumption and aggregate income. Services growth, triggered in part by outsourcing to India, along consumption and investment demand financed with debt created on the liquidity base that foreign capital inflows create, are determining the nature of growth and its sectoral composition. That makes the growth process unstable and probably fragile.
(This article was originally published in the Business Line on June 4, 2018.)
