Household savings in Troubled Times
The experience of depositors in the Punjab and Maharashtra Cooperative Bank (PMCB) suggests that the government and the central bank are unwilling to protect the financial savings of ordinary households. Besides allowing depositors in the bank to access only a maximum of Rs.50,000 from their savings, more than a month and half after the cooperative bank was asked to cease its business because of potential insolvency, the government is ‘considering’ raising the woefully inadequate level of deposit insurance from Rs. 1 lakh to just Rs. 2 lakh. It is to be expected that this and other similar experiences are likely to change the savings behaviour of households.
In fact, available evidence suggests that such changes are already underway. Thus, over the six years ending 2017-18 households have significantly changed their savings behaviour. If we examine the rate of gross financial savings, which is saving excluding changes in household liabilities, we find that it has remained more or less constant in the 10.7 to 10.9 per cent rang. The exception was the demonetisation year 2016-17, when the shock resulted in the gross financial saving of households falling by one and a half percentage points (Chart 1).

The gross financial savings rate bounced back to 10.9 per cent in 2017-18, the year after demonetisation. However, the net financial savings rate of households, which takes account of the liabilities of households as well, which had fallen from 8.1 to 6.3 per cent between 2015-16 and 2016-17, remained at 6.4 per cent in 2017-18 as well (Chart 1). Clearly, the borrowing of households hit by the demonetisation shock has increased in the wake of that shock.
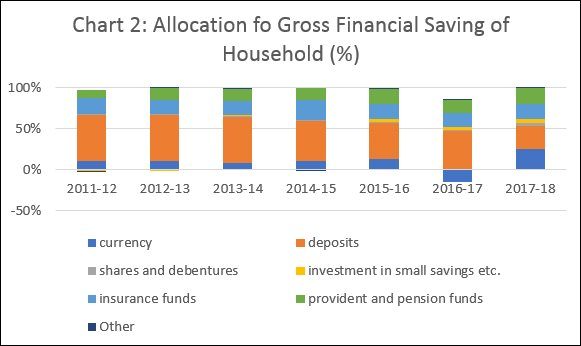
But it is not just borrowing by households that rose after demonetisation, but the way in which they allocate their financial savings. As is to be expected, as households were forced to deposit in banks the supposedly “high valued” notes that had been notified for withdrawal from circulation, the share of cash in the gross financial savings of households, which stood at 13.1 per cent in 2015-16, fell by 22 per cent in 2017-18, whereas the share of deposits rose from 43.1 per cent to 67.8 per cent (Chart 2). But the rush to deposit in banks did not last even into the subsequent year. Deposits with banks had accounted for more than 50 per cent of gross financial savings of households over 2011-12 to 2013-14 and fell to 48.7 and 43.1 per cent in 2014-15 and 2015-16, before demonetisation drover it up. In 2017-18, it stood at the relatively low level of 27.1 per cent.
Households are showing a marked tendency to stay out of bank deposits. This may partly be because of falling interest rates on deposits and partly because of the fears created by evidence of large non-performing assets on the books of banks and the draft Financial Resolution and Deposit Insurance (FRDI). Though the FRDI was withdrawn because of opposition, the fact that it spoke of a “bail-in” of insolvent banks, in which all “stakeholders” including depositors were to be asked to pay a price to solve the problems of ailing banks, rather than using taxpayers’ money. For all these reasons, households were clearly looking for safe havens for their saving, investing the surpluses in government sponsored small savings schemes and in provident and pension funds. The share of those two instruments in the gross financial savings of households, having risen from 7.9 per cent to 15.3 per cent between 2011-12 and 2014-15, settled at 23, 26.7 and 24 per cent respectively in the subsequent three years.

These trends are puzzling when seen in the context of the fall in the net financial savings rate of households, because of an increase in their liabilities. Non-performing assets and provisioning for losses have made banks cautious, resulting in a deceleration of credit growth. If households are also pulling their savings out of bank deposits, which is the base on which bank create credit, this trend would only be aggravated. So how are households borrowing more in the wake of demonetisation?
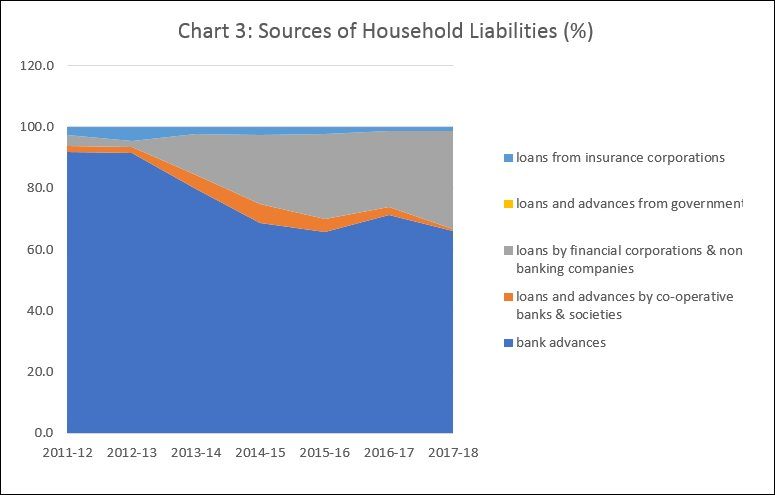
Advances from banks that accounted for more than 90 per cent of household liabilities in 2011-12 and 2012-13, registered a fall in their share to 69 per cent in 2014-15. They remained more or less at that level until 2017-18 (Chart 3). On the other hand, loans and advances from financial corporations and non-bank financial companies (NBFCs), rose from 2-3 per cent in 2011-12 and 2013-13 to 22.5 per cent in 2014-15, and 31.9 per cent in 2017-18.

In other words, as banks came under stress and became cautious in their lending behaviour, the slack was taken up by the NBFCs. These which saw a huge increase in their loan portfolios, lending for investment in housing and purchases of automobiles and consumer durables, besides supporting real estate developers with credit to increase the supply of housing. The capital to support this increased activity came in substantial measure from the issue of short-term instruments that had to be rolled over to sustain the capital base of these institutions. As the trouble in banking and its ripple effects elsewhere in the financial system intensified, the ease with which loans to support the lending activity of the NBFCs could be rolled over declined, leading to the NBFC crisis, worsened by the absence of due diligence in the boom years.
It is this combination of factors that underlies the pervasive demand squeeze and growth slowdown in the economy. Unless measures are taken to counter such a downturn by stimulating demand through state expenditure, the slowdown will only intensify and turn into a recession. How this would further change household saving behaviour is yet to be seen. But the resort to increased borrowing from NBFCs is unlikely to continue. In the event, net saving by households would increase, depressing consumption further and worsening the recession.
(This article was originally published in the Business Line on November 19, 2019)
