Questioning India’s GDP figures
A post-Budget survey of 189 CEOs and CFOs has found that a majority of them find the Central Statistical Organisation’s new growth estimate of over 7 per cent for 2014-15 to be too optimistic and “too good to be realistic”. That figure is based on the CSO’s new GDP estimates with base year 2011-12, which replace the earlier estimates with 2004-05 as base.
The decision to revise the base year is, of course, routine and in keeping with accepted practice. To take account of structural changes, accommodate new and better datasets, use improved methodologies of estimation and harmonise statistical practices with those adopted internationally, statistical agencies the world over update their estimates. But the scepticism expressed above arises because of the results of the exercise, especially the revised growth rates. As opposed to the impression that has prevailed thus far that India’s growth (in terms of GDP at constant market prices) has decelerated after 2010-11, declining from 10.3 per cent in that year to 6.6 per cent, 4.7 per cent and 5 per cent in the three years ending 2013-14, the new estimates point to a rather robust recovery in growth rates.
Thus, between 2012-13 and 2013-14, as compared to a rise in the rate of growth from 4.7 to 5.0 per cent based on the earlier series, the rate rise now takes it from 5.1 to 6.9 per cent. Moreover, advance estimates for 2014-15 indicate that growth for that year is as high as 7.5 per cent. The view that this is not a correct reflection of what has been happening has been widespread. Even the Chief Economic Advisor of the Government of India has suggested that this kind of surge in growth has possibly not occurred, even though there has been a recovery in growth after 2011-12.
Besides the magnitude of the recovery, there are other features of the new National Income estimates that strengthen this scepticism. To start with, while the growth rates of GDP at market prices yielded by the new estimates are higher, the absolute values of GDP at current market prices as per the new series are lower than the corresponding values in the series with 2004-05 as base.
The figures are as much as 2 per cent lower than that based on the old series (2004-05 base) in 2011-12 and 1.2 per cent in 2012-13, while it is marginally lower to the extent of 0.04 per cent in 2013-14. Secondly, while the growth rates from the 2011-12 series are rising significantly over 2012-13 and 2013-14, the rate of investment as measured by the ratio of Gross Capital Formation to GDP has fallen from 38.2 per cent, to 36.6 per cent and 32.3 per cent. This contrary movement in the investment rate and the growth rate points to a sudden improvement in the efficiency of investment that is difficult to explain.
The changes in data sources and methods that lead to these differences between the two series for the years in which both are available are many. But important among them are the following: (i) Use of the Ministry of Corporate Affairs’ MCA21 corporate database as opposed to the Annual Survey of Industries for data on organised manufacturing, as a result of which the coverage of the non-manufacturing activities of companies is now much better. Since as a result trade carried out by manufacturing companies is now recorded under manufacturing, the figures for the trade sector turn out lower than the earlier estimates based on the establishment approach. (ii) Shift from the 1999-2000 National Sample Survey to the more recent 2010-11 survey estimates for unorganised trade enterprises, which of course is completely defensible. And (iii) Use of sales and service tax collections in estimating GDP in the non-financial services sector.
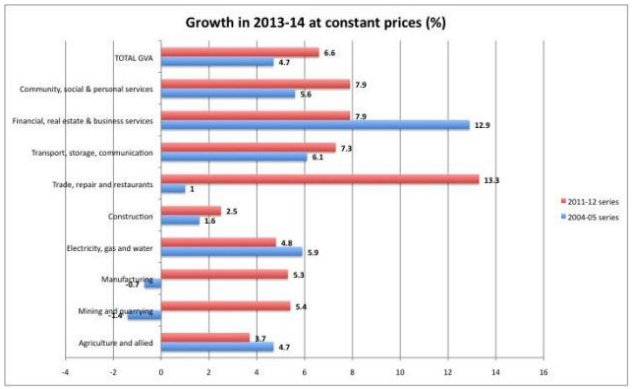
It hardly bears stating that not all of these changes are “necessary”. Some like the first and the third of the three noted above are a matter of choice based on subjective judgements of appropriateness. Their use has clearly affected the overall estimates, and resulted in significant variations in the difference in the growth rates derived from estimates based on the old and new series for individual disaggregated industry groups (See Chart). The new series shows growth in gross value added in the manufacturing sector as 5.3 per cent in 2013-14, whereas the old series found it had shrunk by 0.7 per cent. Financial, real estate and business services are now shown as growing at a lower 7.9 per cent as compared with 12.9 per cent in the previous estimates. And, in the case of trade, repairs, hotels and restaurants the new growth rate is 13.3 as compared with 1.0 in the old series.

Moreover, the new series seems to indicate that the share of the manufacturing sector in total Gross Value Added is significantly higher and that of services significantly lower. This is the obviously result of including services undertaken within manufacturing firms in the manufacturing sector, whereas the earlier establishment approach left them out. In sum, the changes adopted by the CSO have influenced the divergence between the estimates yielded by the old and new series. Since not all of those changes are “unavoidable”, but some a matter of choice, if this divergence is not seen as credible there are grounds to be sceptical about the picture the new series presents, if that does not tally with felt experience. Unfortunately, however, all estimates starting from that for 2014-15 will be based on the new series. That introduces an avoidable element of potential disagreement on the state of the economy.
(This article was originally published in The Hindu on March 12, 2015.)
